
I know we basically just did this, but I’m trying to get back on track with blogging. Since this particular blog is still so new, I’m still figuring out an actual post format. The overall goal is still to keep this blog as a mostly quilting/sewing/fabric-porn blog, but running is a humongous part of my life, and if I’m only going to talk about it once per week, I’m going to cram as much into it as possible. Which brings me to my next point, I’m going to try and delve into the technical as well as the fun for these posts. I want to talk about how much I love running and why I run and all that jazz, but there’s really only so much I can do with that before you’re all like “shut up already, we get it.” So, I’m going to try something else. I’m going to try this thing where I do some data analysis and don’t just tell you what I ran this week. Which means you need some background. And then we can talk about the running and I promise there are pretty rainbow graphs.
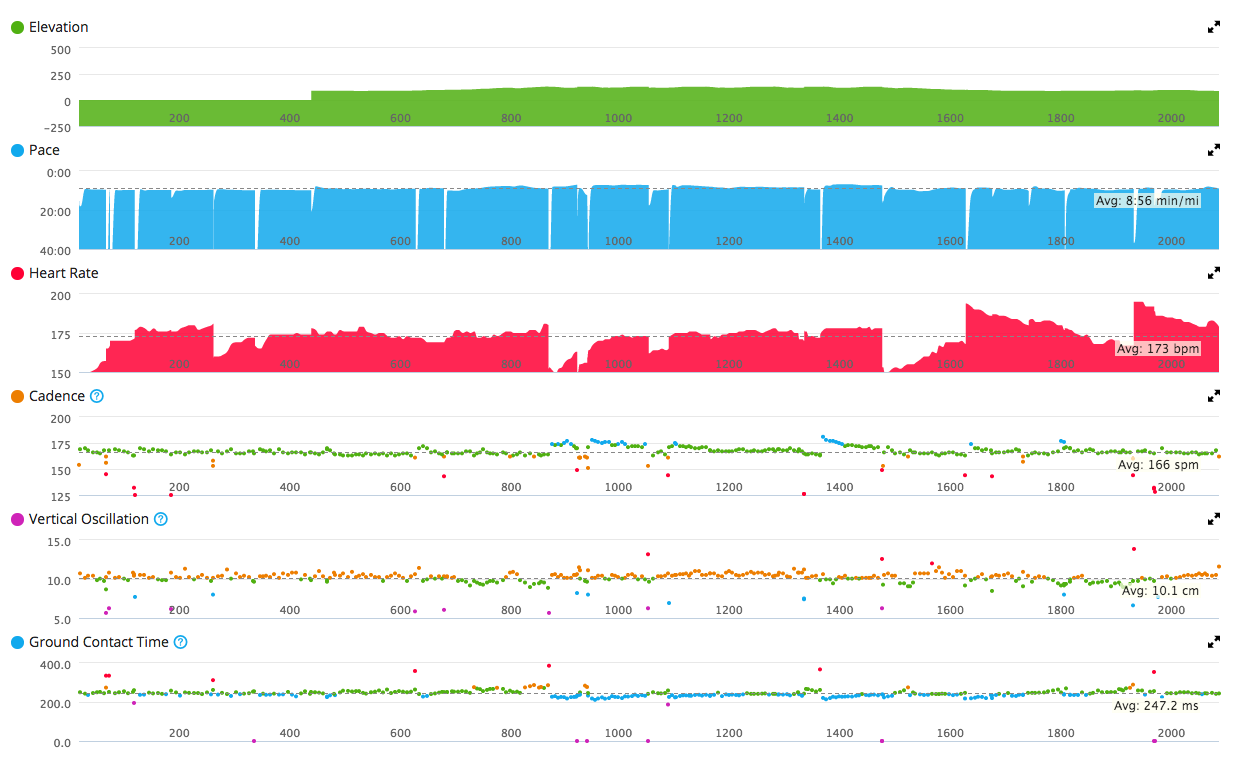
I run with a Garmin Forerunner 620. No, they didn’t give it to me for free, and no, they don’t pay me. My Garmin has a chest strap to monitor my heart rate, as well as eight million other fantastic awesome things. I go for a run, and then it spits out fantastic interactive graphs for me to look at. It gives me three standard graphs that are basic, straight data. Elevation over time, pace over time, heart rate over time. The other three are percentile-based, which makes them a little harder to read but a lot more fun to look at!
The graphing behind cadence, vertical oscillation, and ground contact time is done the same way. Each point is ranked individually based on data that Garmin has amassed and determined percentiles based on the rest of everyone. So, purple points put you above the 95th percentile, blue 70th-95th percentile, green 30-69th percentile, orange 5-29th percentile, and red is below the 5th percentile. Vertical Oscillation and ground contact time both want low numbers – the less you move up and down, and the less time your feet spend touching the ground before you take your next step, the more efficient you are. Cadence wants higher numbers, since the faster you move your feet, the faster you run.
One last note before we dive into this week. I love data, and I do have some experience with data analysis. I do not, however, have any real qualifications as far as analyzing this data. If you do, and I’m wrong on anything regarding this data, let me know. I’d love to get it right!
Monday, June 15:
Planned: 3 Miles
Actual: 2.83 Miles
Pace: 9:19/mile
I was a little short on Monday, but it was hot. We ran our 5 States route, and by the time we got back up to 15th St, I was not at all interested in running up Rhode Island to 14th to get back to the store. But hey, I’m good with it.

Capture ALL the data!!!

Data Overview
So, what does this data mean? Well, for starters, it means that I didn’t have the BEST run on Monday, at least technically. I felt pretty good, which has to be worth something, right? My cadence was pretty solid, as it looks like I’m tracking mostly green. The red spots match up with breaks in pace, which is where we hit traffic lights. My ground contact time looks even better, although there are those red spots again, but they seem to line up with the breaks in pace as well, which makes sense. I need to improve my vertical oscillation, which is tracking orange. So, no more bouncing, I guess?
The summary data tells us that based on my heart rate, I had a fantastic run and that I’m seriously improving. This information is probably the most interesting for me. I’m on stimulants to deal with a sleep disorder, which increases my heart rate. Without meds, I have seriously low blood pressure and my resting heart rate is something like 58. It’s fun to watch it skyrocket, and I’ve been enjoying watching the changes. My average cadence was 167. The overall target is 180, so I’m doing well there. Vertical oscillation is high, which is really interesting. Higher vertical oscillation is connected to shorter ground contact time and faster pace, but it’s theoretically less economical. So, run fast but not too fast? As far as ground contact time goes, I’m actually really happy with 237 milliseconds. Elites track at under 200 ms, which means I’m really not too far off there.
Tuesday, June 16
Planned: 6 Miles
Actual: 5.83 Miles
Pace: 11:15/mile
Hm, I’m seeing a pattern here. I was a little short on Tuesday, and WAY slower than normal, but I had good reasons. To start with, I’ve never run this route all the way through before. I’ve never been fast enough to run this route before. You see, we start off essentially racing the clock if we’re not careful about leaving basically right at 7PM. We ran from the store to the Zoo. It’s about 3.5 miles to the Zoo, and they close somewhere between 7:45 and 8:00. When you add in traffic and the heat and the hills (oh god the hills), it can run late. I did opt to walk the hills, but Garmin says it was 93* outside, and it was way too hot and humid.

June 16 Graphs

June 16 Overview
So, clearly my watch and my run were off a little. I love that as soon as we were walking up the hill, it looks like I was floating. That’s right guys, I can fly! But otherwise, I look good except for the two hills we walked up. I can live with it, I think. As far as summary data, it’s interesting that the training effect is “overtraining.” I don’t feel overtrained, although I did wake up out of a dead sleep screaming later that night with a charley horse (cramp in my calf) that’s left a very sore knot. I’m really okay with this route looking so freaking terrible, as far as data goes. Or at least, I’m trying to be. We’ll run the route again either later this summer or in the fall, and I’m hoping there will be significant improvement.
Thursday, June 18:
Planned: 1 mile to track, 400m sprint, 200m rest, 800m sprint-ish, 200m rest, 400m sprint, 200m rest, 200m all out sprint, 1 mile back to store.
Actual: 0.5 miles to office, 1.5 miles to track, 200m sprint, 200m rest, 400m sprint, 200m rest, 800m sprint-ish, 200m rest, 400m sprint, 1 mile back to store.
HA. Last night was just off. My normal routine is to change at work, walk to the store dressed like a normal person, drop my shirt in bag before we run, run, get dressed, metro home. Well, last night, I got all the way to the store and then realized I forgot my watch in my office. So, I dropped my shirt in my bag, told the group I’d meet them at the track, and then ran back to the office to grab my watch. And ran in to my boss. Awk.ward. Fortunately, it seems that he’s not going to make it a thing. So, I got up to the track and missed the first 400m sprint and the first 600 of the first 800m. I jumped in and started there. It did feel good to be on the track, and I did feel fairly in control of my pace and my legs and my body. That was nice. I ran my 800 in 4:00, which is an 8:00 mile, and then seemed to be holding on to a 7:30-7:15 pace for the 400s.
Track Workout June 18

Overview: June 18
I’m still working on figuring out the best way to work this data, so I’m going to leave it at “ooooh, pretty colors!” for now.
